Personal Projects
The Evolution of NBA Team’s Field Goal Attempts
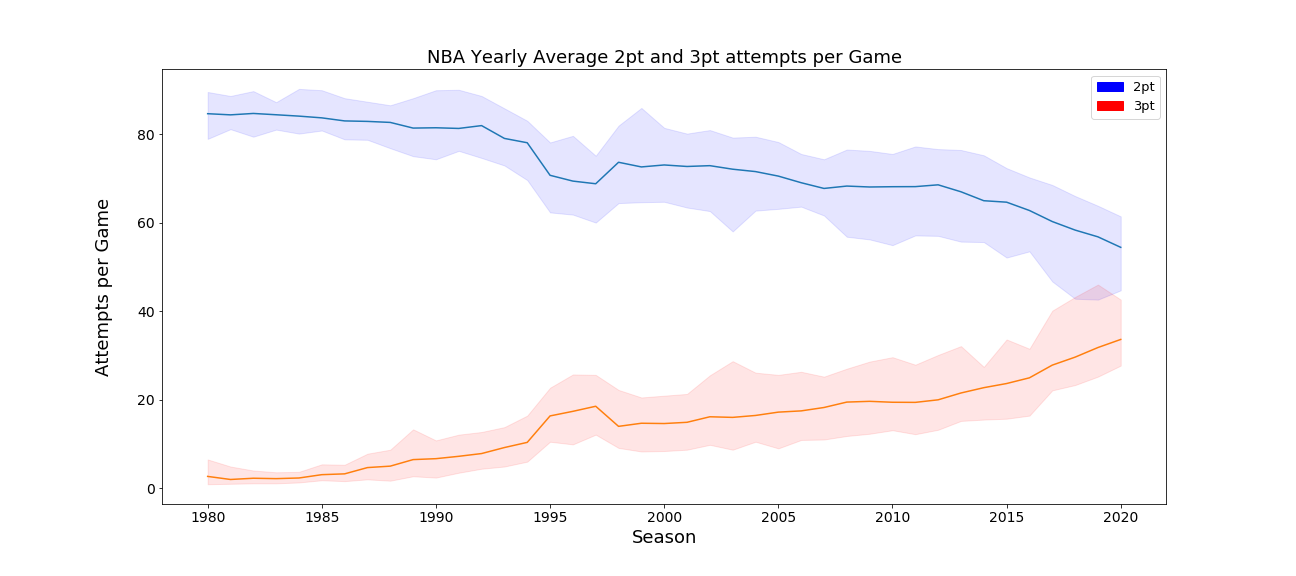
The graph above plots every team’s average 2-pt and 3-pt field goal attempts per game. The shaded area represents the difference between the maximum and minimum field goal attempts per each year. This data was useful in conducting the following analysis. Note: the year listed represents the second year of the NBA season, so 1980 is the 1979-80 season (the first season with 3-pointers), while 2020 is the 2019-20 season.
Predicting NBA Playoff Series Winners
Like many people, I was bummed out that the NBA season was put on hold this year (2020) due to the corona virus. At first, there was uncertainty surrounding whether or no the season would return. Thus, I decided to see if I could use my Data Science skills to project who would win the NBA finals. I began by scraping team stats, specifically home and road splits, and regular season game results from basketball-reference.com and yearly standings from landofbasketball.com.
A team’s point output in an individual game can be modeled by a poisson distribution. As there are three ways to score in an NBA game, I broke a teams score into three categories: two pointers, three pointers, and free throws. Additionally, each team has some defensive capacity to prevent scoring, represented through opposing field goal and free throw statistics. As such, I needed to determine some way of measuring the relative weights that the team’s offensive stats and the opposititons’s defensive potential impact a team’s point output. I did so by using the score of every regular season game to develop of a simple linear model. The target variable of this model was an individual team’s score, while the explanatory variables were that team’s offensive points per game and the opposition’s points allowed per game. I did this for every season since 1984, the first year with reliable home-road split stats. Using the weights from these models, I was able to determine a team’s point output for a given game as follows:
After calculating scores for both teams, I predicted a winner by selecting the team with a larger score. I then repeated this process 15,000 times for each game and simulated each series 15,000 times to determine the winner. Currently, this model is 75% accurate in predicting past series winners and projects the Milwaukee Bucks as the 2020 NBA champions. This method is imperfect in several key ways, namely it does not account for injuries, player acquisitions, or other key events that alter a team’s score output. Instead, it serves as a baseline for further simulations. The repository for this project can be found here.
Does Your Vote Matter?
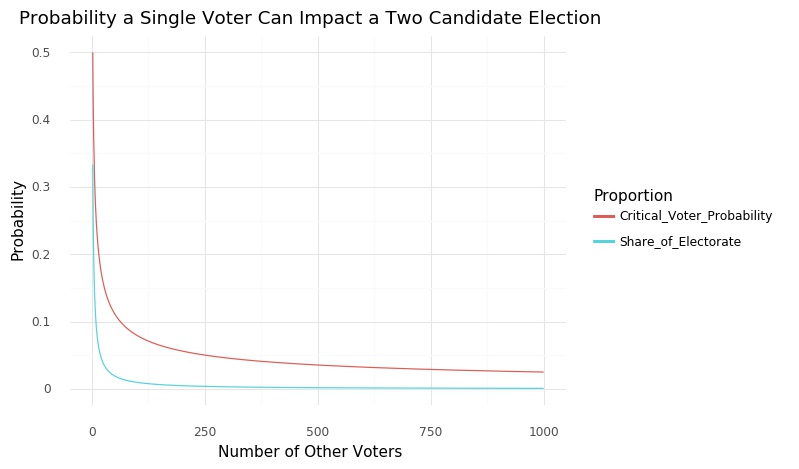
Using combinatorix, I created a probability model for the likelihood that a single voter can impact an election. As seen in the graph above, I found and proved that, given that the all the possible ways the other voters can vote are equally likely, the probability that a single voter can impact an election is actually greater than that voter’s share of the vote. This assumption may not always hold, but the finding show that an individual’s impact on democracy is greater than what some cynics might think. A full blogpost can be found here.
Linear Regression in Sklearn versus Statsmodels
I analyzed the differences between performing sklearn and statsmodels in this blogpost. In the article, I explore the difference beyond the syntax by evaluating the underlying algorithms, efficicency, and models of both classes.